Dynamic Chart displays live data to ASP.NET MVC projects through API and databases. Many javascript libraries have been used to implement charts, like Chart.js, CanvasJS, etc. However, I will be using CanvasJS in this article.
In this article, I will describe the following points:
What is CanvasJS?
Creating an ASP.NET MVC 6 Project
Using CanvasJS in ASP.NET MVC 6 Project
Inserting Live API Data in Chart
Formatting Chart
Prerequisites:
Visual Studio 2022 installed on your machine
Basic knowledge of JavaScript
What is CanvasJS?
CanvasJS is a JavaScript library with rich UI and multiple functionalities. It allows us to implement charts in our ASP.NET MVC project. We can provide both static and dynamic data to render in charts. CanvasJS generates multiple types of charts, like Line Chart, Bar Chart, Area Chart, Donut Chart, and a lot more. To know more about CanvasJS, please refer here.
Creating an ASP.NET MVC Project
To create an ASP.NET MVC Project, please refer to my previous article, linked below:
Creating an ASP.NET MVC 6 Project
Using CanvasJS in ASP.NET MVC Project
To implement the chart, you need to follow the steps given below.
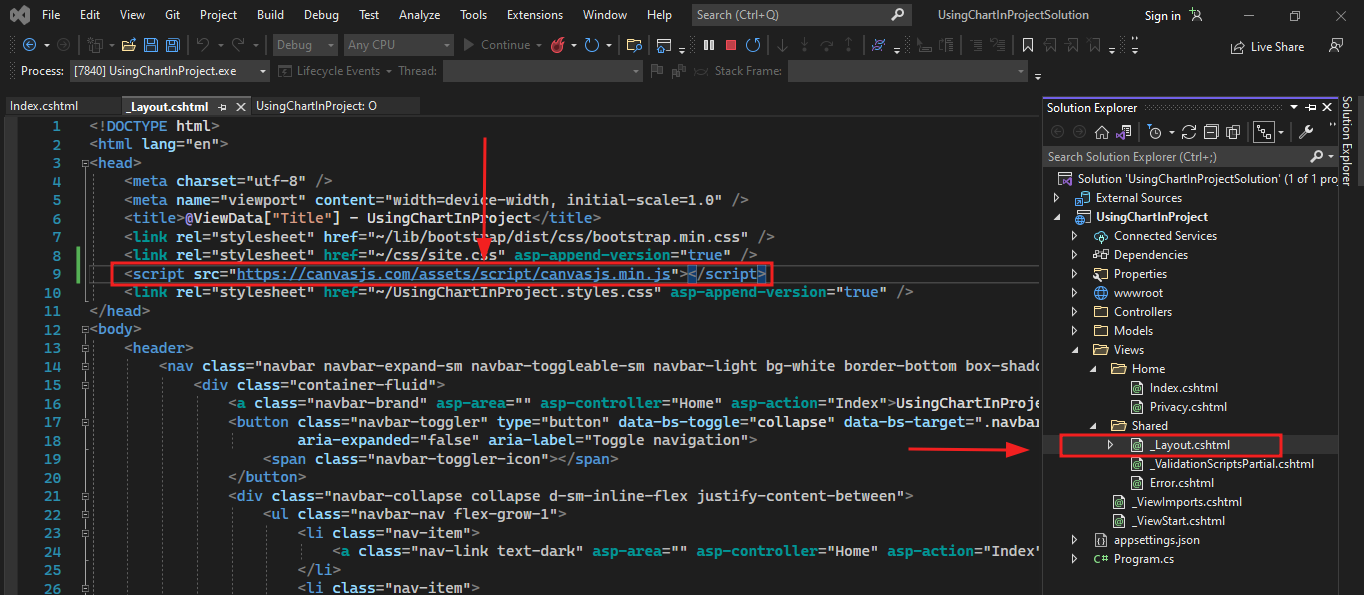
First, you will add the CanvasJS JavaScript file link in the _Layout.cshtml file as given below:
<script src="https://canvasjs.com/assets/script/canvasjs.min.js"></script>
Now, add the chart inside Home View using JavaScript as given below:
<script type="text/javascript">
window.onload = function () {
var chart = new CanvasJS.Chart("chartContainer", {
title:{
text: "My First Chart in ASP.NET MVC"
},
data: [
{
// Change type to "doughnut", "line", "splineArea", etc.
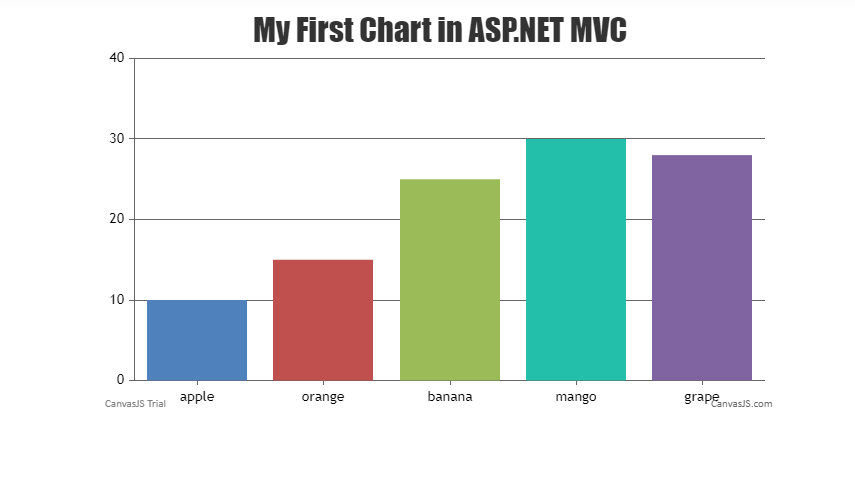
type: "column",
dataPoints: [
{ label: "apple", y: 10 },
{ label: "orange", y: 15 },
{ label: "banana", y: 25 },
{ label: "mango", y: 30 },
{ label: "grape", y: 28 }
]
}
]
});
chart.render();
}
</script>
You need to create a <div> tag inside the <body> tag, having id chartContainer to render the the function given above.
<div id="chartContainer" style="height: 400px; width: 60%;"></div>
Markup
Set the height and width according to your needs, as given in the above code.
Output
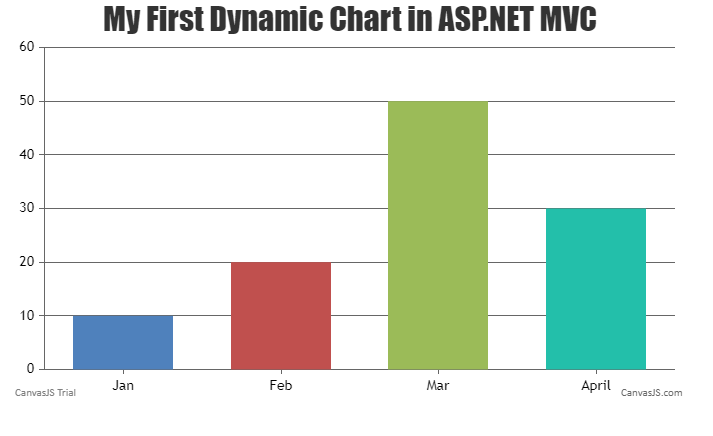
Inserting Live API Data in Chart
Above, we used static data to represent the chart. Now we will use live API data. We have created a demo sale API that contains data on monthly sales.
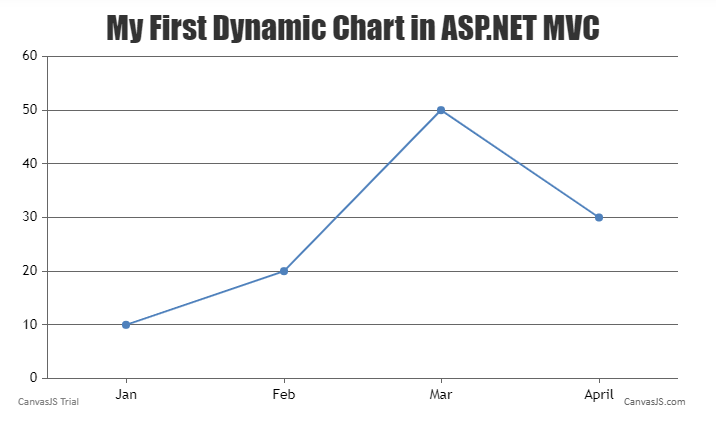
Formatting Chart
We can show our data in any form, like a line chart, area chart, etc. if we change the type to the line as given below:
data: [
{
// Change type to "doughnut", "line", "splineArea", etc.
type: "line",
dataPoints:
@Html.Raw(ViewBag.Data)
//[
// { label: "apple", y: 10 },
// { label: "orange", y: 15 },
// { label: "banana", y: 25 },
// { label: "mango", y: 30 },
// { label: "grape", y: 28 }
//]
}
]
Output
This Article In a Nutshell:
First, you need to create an ASP.NET MVC project in Visual Studio 2022.
Add the CanvasJs JavaScript file link in your View from here.
Now, add the JavaScript code to your View.
Map the API data with the Chart data points and store it in the ViewBag.
Use ViewBag data inside JavaScript code.
Conclusion
In this way, you can add charts to your ASP.NET MVC project. The most important part is mapping the API data to the chart data points so that you can easily store that into ViewBag. Then, you can use it inside JavaScript code.